Stupid RenderMan Tricks - Siggraph 2009
For Siggraph 2009 (New Orleans) one of my shader tricks was chosen as a winning entry of Pixar's annual "Stupid RenderMan Tricks" segment of the RenderMan Users' Group meeting. That night, I presented my trick, along with a group from Weta Digital and a gentleman from MPC (Moving Pictures Company.)The trick was surprisingly well received and turned out to be the highlight of the evening.
This trick is actually a combination of two related projects that I produced for Malcolm's "ST Coloration" and "Pattern Animation" project.
Point Cache Trick - Breakdown [Pt. 1]
Simple Procedural Pattern Generation
 |
 |
 |
 |
 |
if((s*s)+(t*t) < 1) |
if(-0.125*(sin((s)* (PI) *5)-1.75) <= (0.5/(1/t))) | if(s >= 0.25 && s <= 0.75) if(t >= 0.25 && t <= 0.75) |
if((((s-.5)*(s-.5))+((t-.5)*(t-.5))<.1) && (((s-.6)*(s-.6))+((t-.5)*(t-.5))>.1)) | if(t + s > 1) |
Representing more Detail
After experimenting with basic shapes and reviewing past student work in this area, I felt the need to represent more complex patterns and images on the ST grid. It would be basically impossible to do this by manually coding the .sl files, but I figured that I can do it by defining point attribute informaiton and extract that information using python. Information will be fed into RenderMan using the same basic instructions used to generate the geometric shapes. With this technique, I can represent any image quite accurately. Because of the procedural nature of this technique, very complex shaders can be defined.
Gathering Information In Houdini
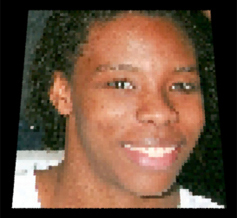
In houdini, I projected an image onto a grid consisting of 2499 points.
 http://karenswhimsy.com/celtic-patterns.shtm |
 |
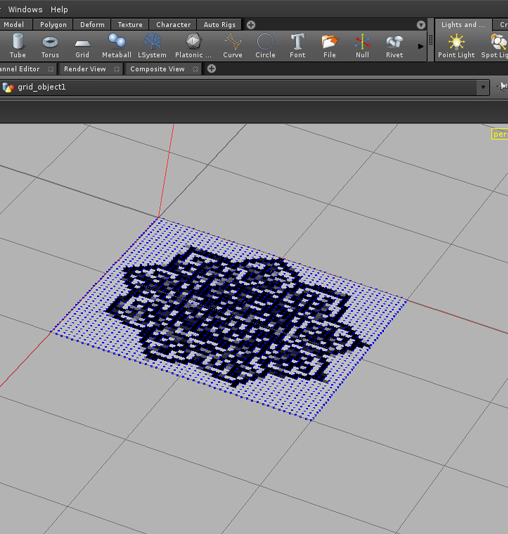 |
The Houdini Network is nothing complex. It is just a grid with an image projected onto it via the "uvproject" node. I add "color" attributes to the points of the grid using the "point" node. These colors are sampled directly from the image. What I am really looking for here is 2 sets of point attributes: location (P) and color (Cd). These can be found in details view and will help me to re-create my image in a renderman shader. I also scaled my grid into a 0 to one world space, to conform to renderman shader's ST world units. |
 |
So the details in houdini is telling me that my image is generated through 2499 points. The X and Z location of these points will help me define the grid in my shader. What I want to do is to represent any image or pattern I would like using these points or more. Additionally, I want to do this in a very efficient way. ...So I started a one day task of learning python's implementation within the Houdini Object Model. Through some language syntax lessons, along with fervent research on Houdini's python functions I was able to design a custom script to extract the information that I need. The two main functions I use are: |
Here is my python code:
This is the main operation in python:
f.write("if (s = %.12f && t = %.12f) \n" % (t,s))
f.write( " surfcolor = color(%.f, %.f, %.f);\n" % (r,g,b))
Which writes this to my shader file for every point defined:
if (s >= 1.000000000000 && t >= 0.942028999329)
surfcolor = color(0.967320203781,0.979085087776,0.979084908962);
Through these precise floats, I can represent a wider range of colors for any image.
Results
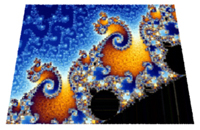
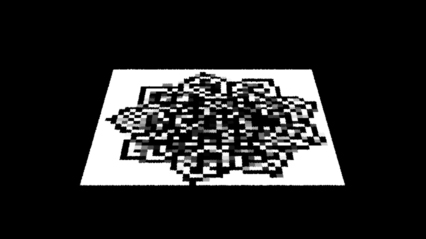 Because I am generating these by defining every grid location and not by curve equations, it can result in a very large .sl file and could take very long to compile. Nevertheless, I can increase the resolution as I see fit to get a sharper image. This technique must be used responsibly to avoid "out of memory" errors. Above is the pattern shader, defined by my python helper script. |
 Representing photoreal surfaces and patterns is what this technique does best. |
 ST Coloration. Here is the Shader Code. |
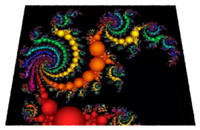
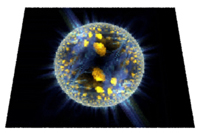
Results using more complicated fractals. Edited my script to add more details by excluding colors that are the same color as the background:
 |
 |
 |
Point Cache Trick - Breakdown [Pt. 2]
This animation and all shaders produced was driven almost completly by python expressions within houdini. What I initially wanted to do for this project was to animate something that does not follow any particular pattern. Something natural. So I thought of animating my signature: "N.B.J". Throughout this project, I also enhanced the functionality of my point cache script that I wrote for ST Coloration. These are the key features making this animation possible:
1. Render points out to rib frames, from directly within houdini
2.
Batch render .SL files, directly from houdini
Preparing the Simulation
In houdini a curve's point properties is driven by a sphere's proximity towards it and CHOP (Channel Operatior) to manipulate channel data. Through manipulating channel data I can drag or freeze a points' attribute information.
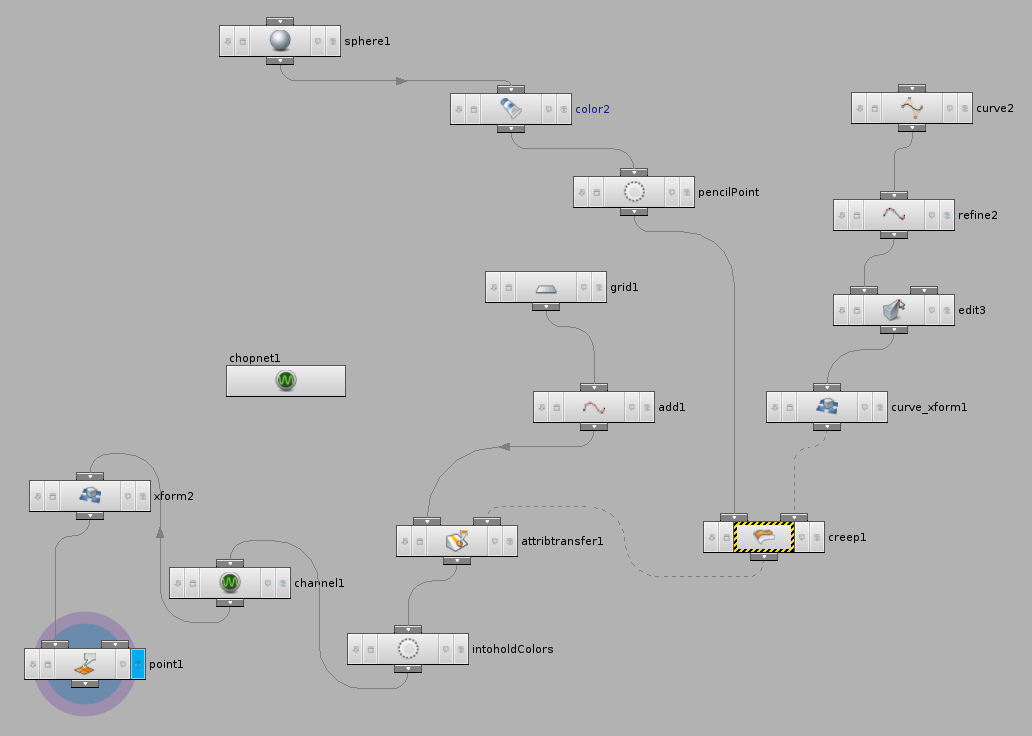 |
Click on the image for a larger view of this network. What this network is doing essentially is using point attributes of a sphere driven by my curve. These point location attributes are transferred to a single point, which is my crayon point location. This will be used to drive my crayon later. Right now, the sphere colors are being transferred to a grid, and the colors are then baked into the grid point attributes by a channel operation. If we were to dive into the "chop network" we will see this: |
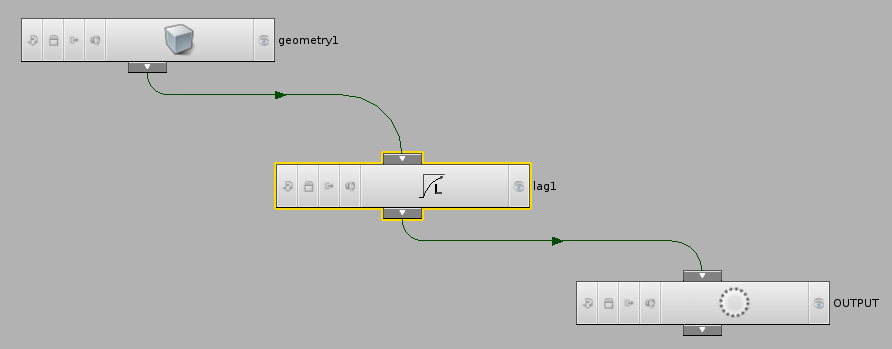
In the end, all that i'm getting is point attributes. This is done through accessing the Houdini Object Model using python. In addition, I am rendering this data directly into rib files and shaders, so I have to add functionality to my script to process multiple frames. I access frame information through hou.frame(). For each point I access, I extract the information and move to another frame using hou.setframe(CurrentFrame+1), where variable CurrentFrame is always equal to hou.frame(). Data extracted is being used in 3 main areas:
1. Generating the shaders by frame number, 2. Generating the point location to drive the crayon, 3. Generating the rib archive that defines frame information.
1.Shaders
Each shader writes a dot to a specific area of the ST grid. It defines the dot with this formula:
if ((s-0.885906040668)*(s-0.885906040668)+(t-0.684563755989)*(t-0.684563755989)<=0.00001)
surfcolor = color(0.065311968327,0.065311968327,1.000000000000);
where 0.00001 is the radius value for each circle. In the initial test, this value proved to be obviously too small, and thus it produces a pattern on the crayon strokes. Because of the procedural nature of this technique, these shaders can get really large. The shader that defines the surface for frame 113 is 18,267 lines long.
2.Crayon Location
A crayon was modelled and put into a rib archive. I extracted attributes for my "pencilPoint" node (this node contains one point, refer to node map above) and use that to drive the rib archive x,y,z values.
3.Main RIB
The main RIB defines 113 frames using 3392 lines of code. Each FrameBegin/FrameEnd block looks like this:
| FrameBegin 64 Display "SignatureAnimation64.tiff" "tiff" "rgba" "compression" ["lzw"] Projection "perspective" "fov" 20 Translate 0 0 3 Rotate -30 1 0 0 Rotate 0 0 1 0 Scale 1 1 -1 WorldBegin TransformBegin LightSource "pointlight" 1 "intensity" 25 "from" [ 1 4 1 ] TransformEnd TransformBegin AttributeBegin Color 0.2 0.2 1 Scale 1 1 1 Translate -0.35 0 -0.55 Translate 0.393165528774 -0.042873490602 0.629077315331 ReadArchive "M:/vsfx319/ribs/markerArchive.rib" AttributeEnd TransformEnd Surface "pattern_64" "Kd" 1.0 AttributeBegin Rotate -90 0 1 0 Rotate 180 1 0 0 Polygon "P" [ -0.5 0 -0.5 -0.5 0 0.5 0.5 0 0.5 0.5 0 -0.5 ] "st" [ 0 0 0 1 1 1 1 0 ] AttributeEnd WorldEnd FrameEnd |
Display "SignatureAnimation64.tiff" and Surface "pattern_64" are taken from hou.frame(). Translate -0.35 0 -0.55 is initially entered into my python script to act as a final correction to the crayon point position. Translate 0.393165528774 -0.042873490602 0.629077315331 is taken from my "pencilPoint" node. |
Animating Crayons
Initial Render. Point radius is 0.00001.
Second Render. Point radius is 0.001. Note the colors being added as the path progresses
Implementing Beizer Curve
In the past, the main problem was figuring out how to reference a large amount of points (from an external source) to represent complex amount of data. I extended my point cache script to overcome this problem and my initial tests proved successful:
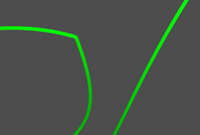 |
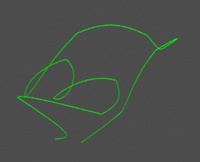 |
Using lists in python I exported raw point data from houdini to see if I would get my houdini curve in renderman. Using this technique, It is possible to produce vector drawings that renders really fast and does not take up as much resources as my ST Coloration technique. |